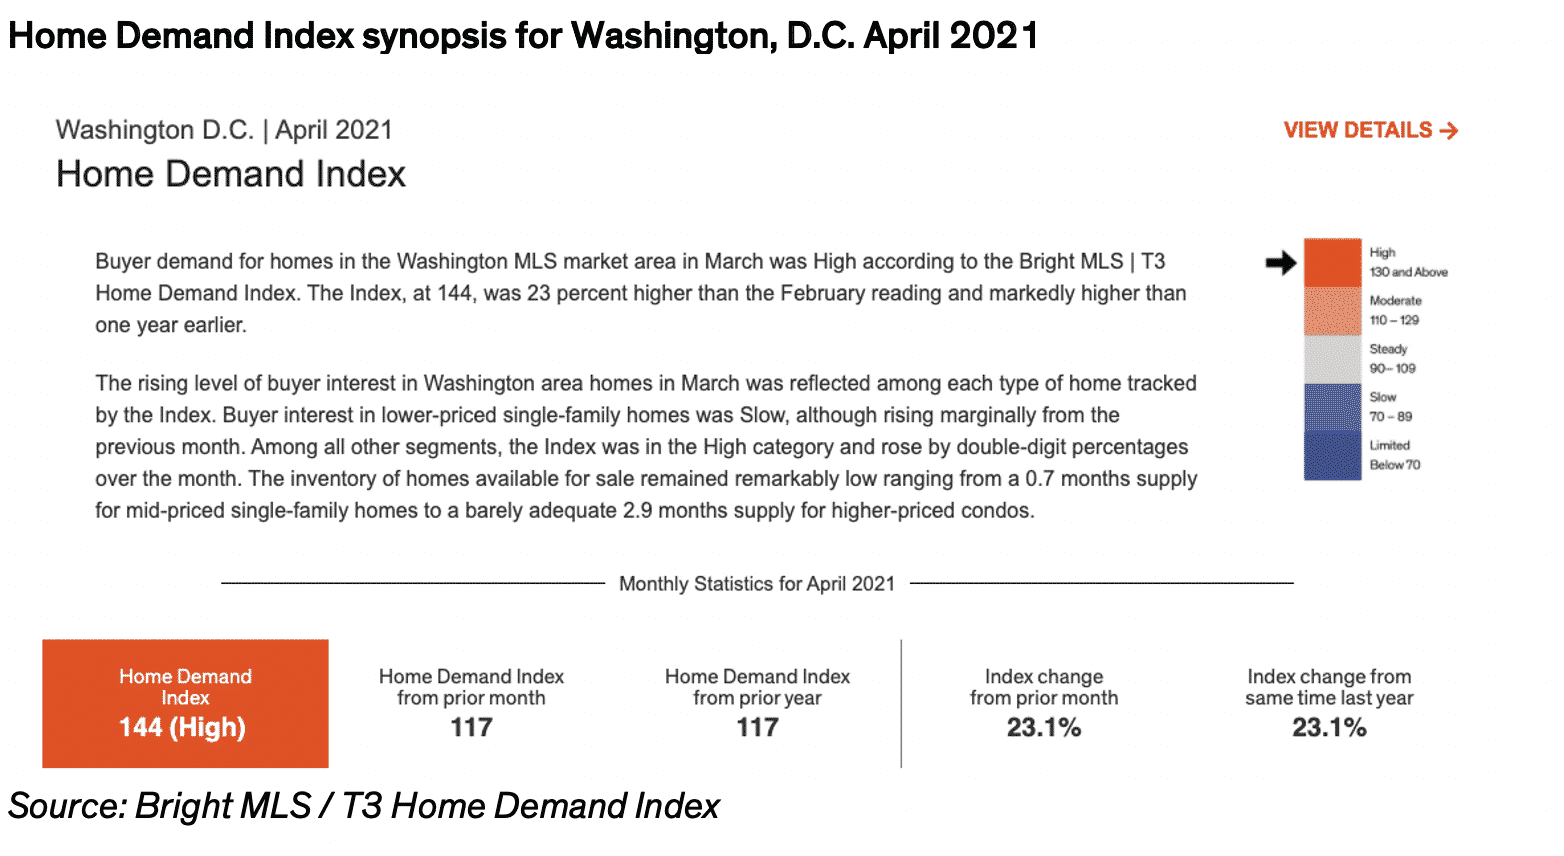
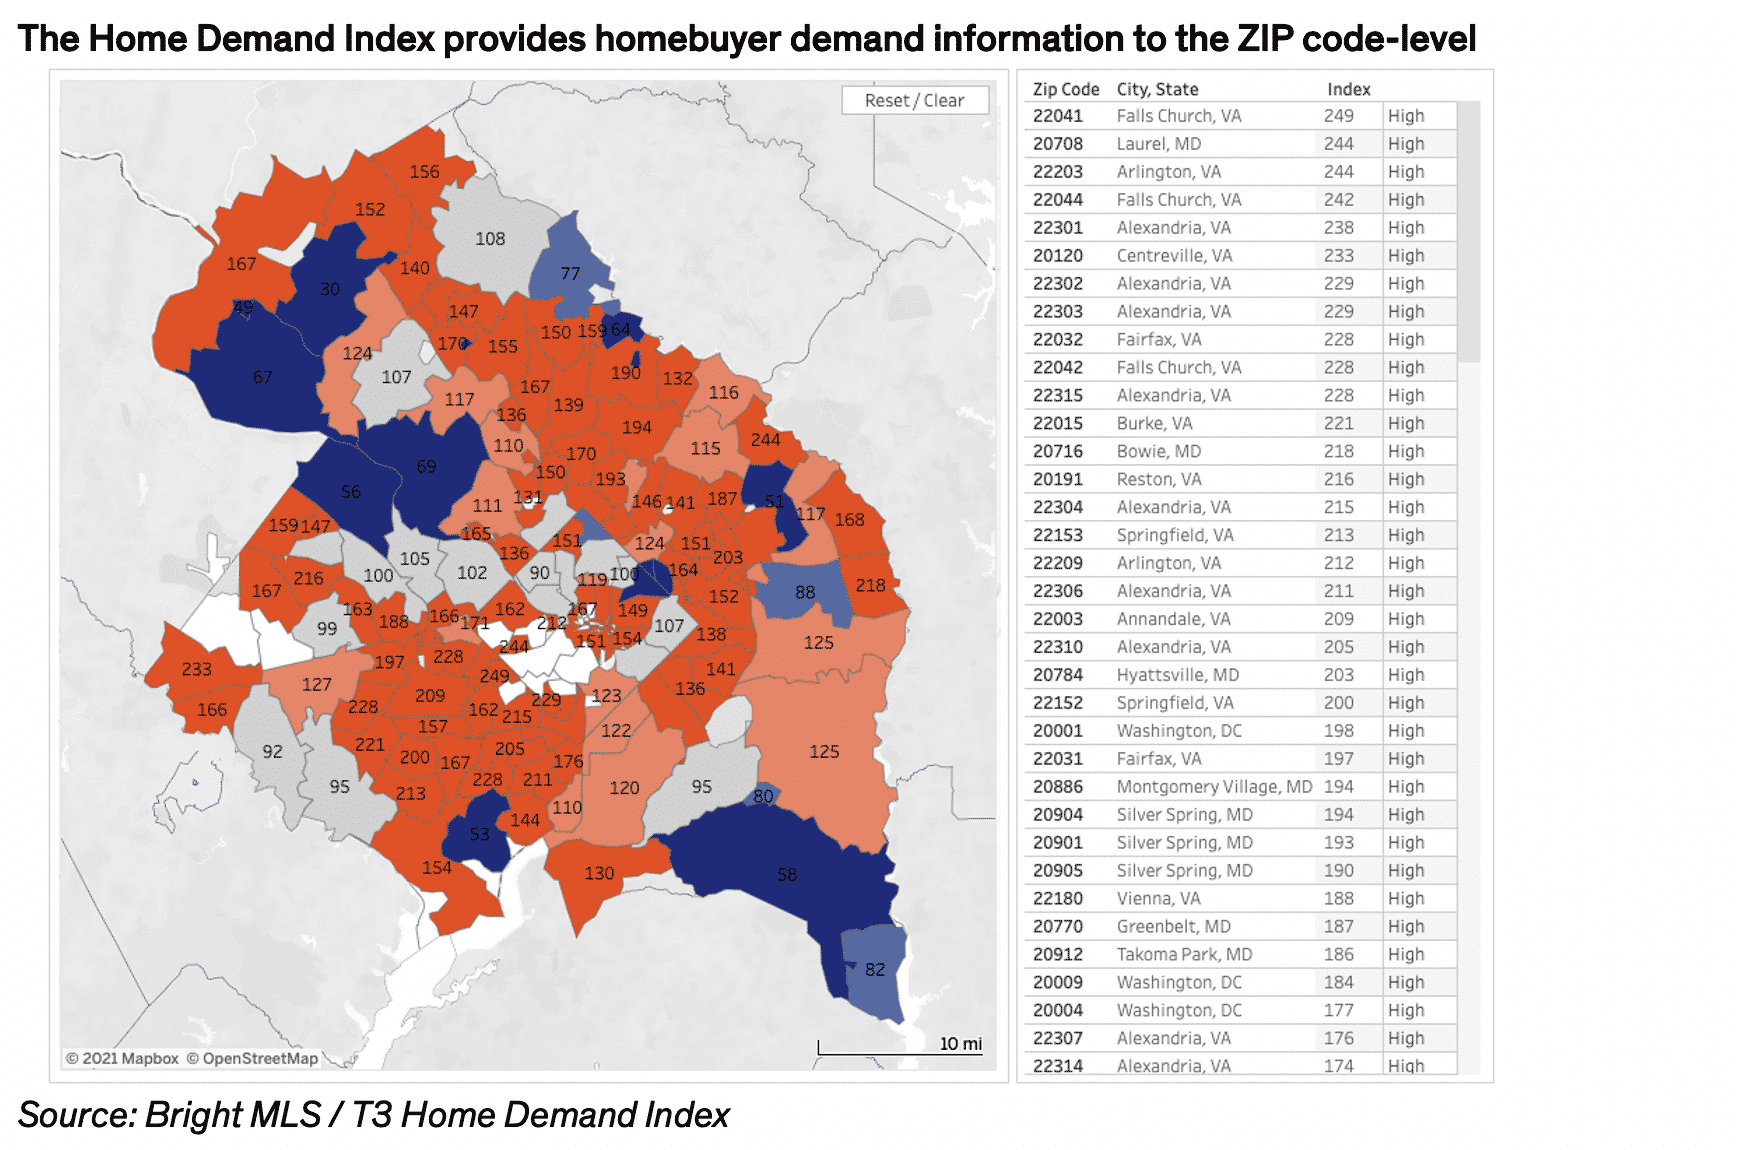
In March, Bright MLS and T3 Sixty launched the Home Demand Index, which provides near real-time insight into homebuyer demand by geography, price point and home type for real estate professionals and consumers. The Index is now live across Bright’s Mid-Atlantic footprint, which covers over 95,000 real estate professionals and 20 million consumers in the markets of Baltimore, Philadelphia and Washington, D.C.
The Index, which T3 Sixty will bring to additional MLSs in the future, pulls MLS info such as showing requests, website visits and home searches to assess the relative demand for housing by the filters outlined above, and updates monthly on approximately the 11th of each month.
The Home Demand Index uses a large variety of data to analyze how buyers are acting in near real-time. This allows agents and consumers to assess this granular demand by these filters that can refine searches, marketing and clarify negotiations. Homebuyer demand is represented by an index number with a baseline set at 100, and presented in five categories:
- High: above 130
- Moderate: 110-129
- Steady: 90-109
- Slow: 70-89
- Limited: below 70

How it’s different
The Home Demand Index represents a new family of real estate analytics. Instead of tracking a single data point such as houses sold, a suite of additional data points are now included in the analysis. Demand can be tracked as soon as a listing is announced as “coming soon” and people start reviewing and visiting the property.
Normal selling activities like showings and internet searches provide significant insights into consumer interest. By combining inventory changes with selling activities, a more extensive part of the sales cycle can be analyzed. Home Demand Index data inputs represent events that can be associated with a listing, e.g, “New Listing,” “Tour,” “Showing,” or “Offer Accepted (status of pending).” Events can be organized to create a lifecycle of the listing, from beginning to end. Machine learning systems can then be trained by this lifecycle assembly of events and, even before a transaction completes, these systems can approximate future events with growing degrees of confidence and accuracy.

Single-factor indexes rely on a single event, typically at the end of the selling process. The information is entered into MLS or public records systems. Information from these systems is made available to the index creators periodically, often on a monthly basis. By the time the information is added, transmitted and processed, the demand captured is many months old. The Home Demand Index can now recognize and identify the shifts much sooner.
As mentioned above, the index presents home demand insight by geography, price point and home type, with the latter two market-specific.

Home Demand Index Use Cases
In a listing appointment, agents can use the new Home Demand Index to support their estimates for price points, marketing efforts and predicted days on market. After securing a listing agreement, agents can use the Index to support feedback sessions with their seller.
On the other side of the transaction, buyers’ agents can use the Index to direct their clients to different homes, areas and price points according to their needs and circumstances. Consumer demand changes monthly, and competition is related to the number of potential buyers looking at available properties.
Takeaway
Buying and selling a home is complex, and without the latest, geographic-specific information available, consumers and their agents may select properties or set listing prices incorrectly. The Home Demand Index provides a fresh and insightful market-wide look into near real-time homebuyer demand data. MLS organizations can now leverage the unique data they already gather for the subscribers and provide them with a better way to serve the consumer.
Learn more by watching T3 Sixty’s webinar on the new tool, or reach out to me, T3 Sixty Chief Technology Officer Mark Lesswing one of the architects of the index, at mark@t3sixty.com.
