After two years of rapid growth, home prices have slowed markedly as the housing market transitions to a period of lower sales amid higher mortgage rates.
According to the latest NAR existing home sales report, the median home price rose 10.2 percent in 2022 to $386,300. That is on top of the 18.2 percent rise in 2021. By December 2022, however, the year-over-year increase in the median price was just 2.3 percent as demand eased.
Some of the most-referenced and most-trusted home price data sources include NAR’s median existing home price report, the S&P CoreLogic Case-Shiller Index and the U.S. Census Bureau’s new home price series.
One price series that gets less attention, but provides some key insights especially at the metro level, is the FHFA Home Price Index. Based on data for conventional, conforming home mortgage loans for single-family properties purchased or securitized by Fannie Mae and Freddie Mac.
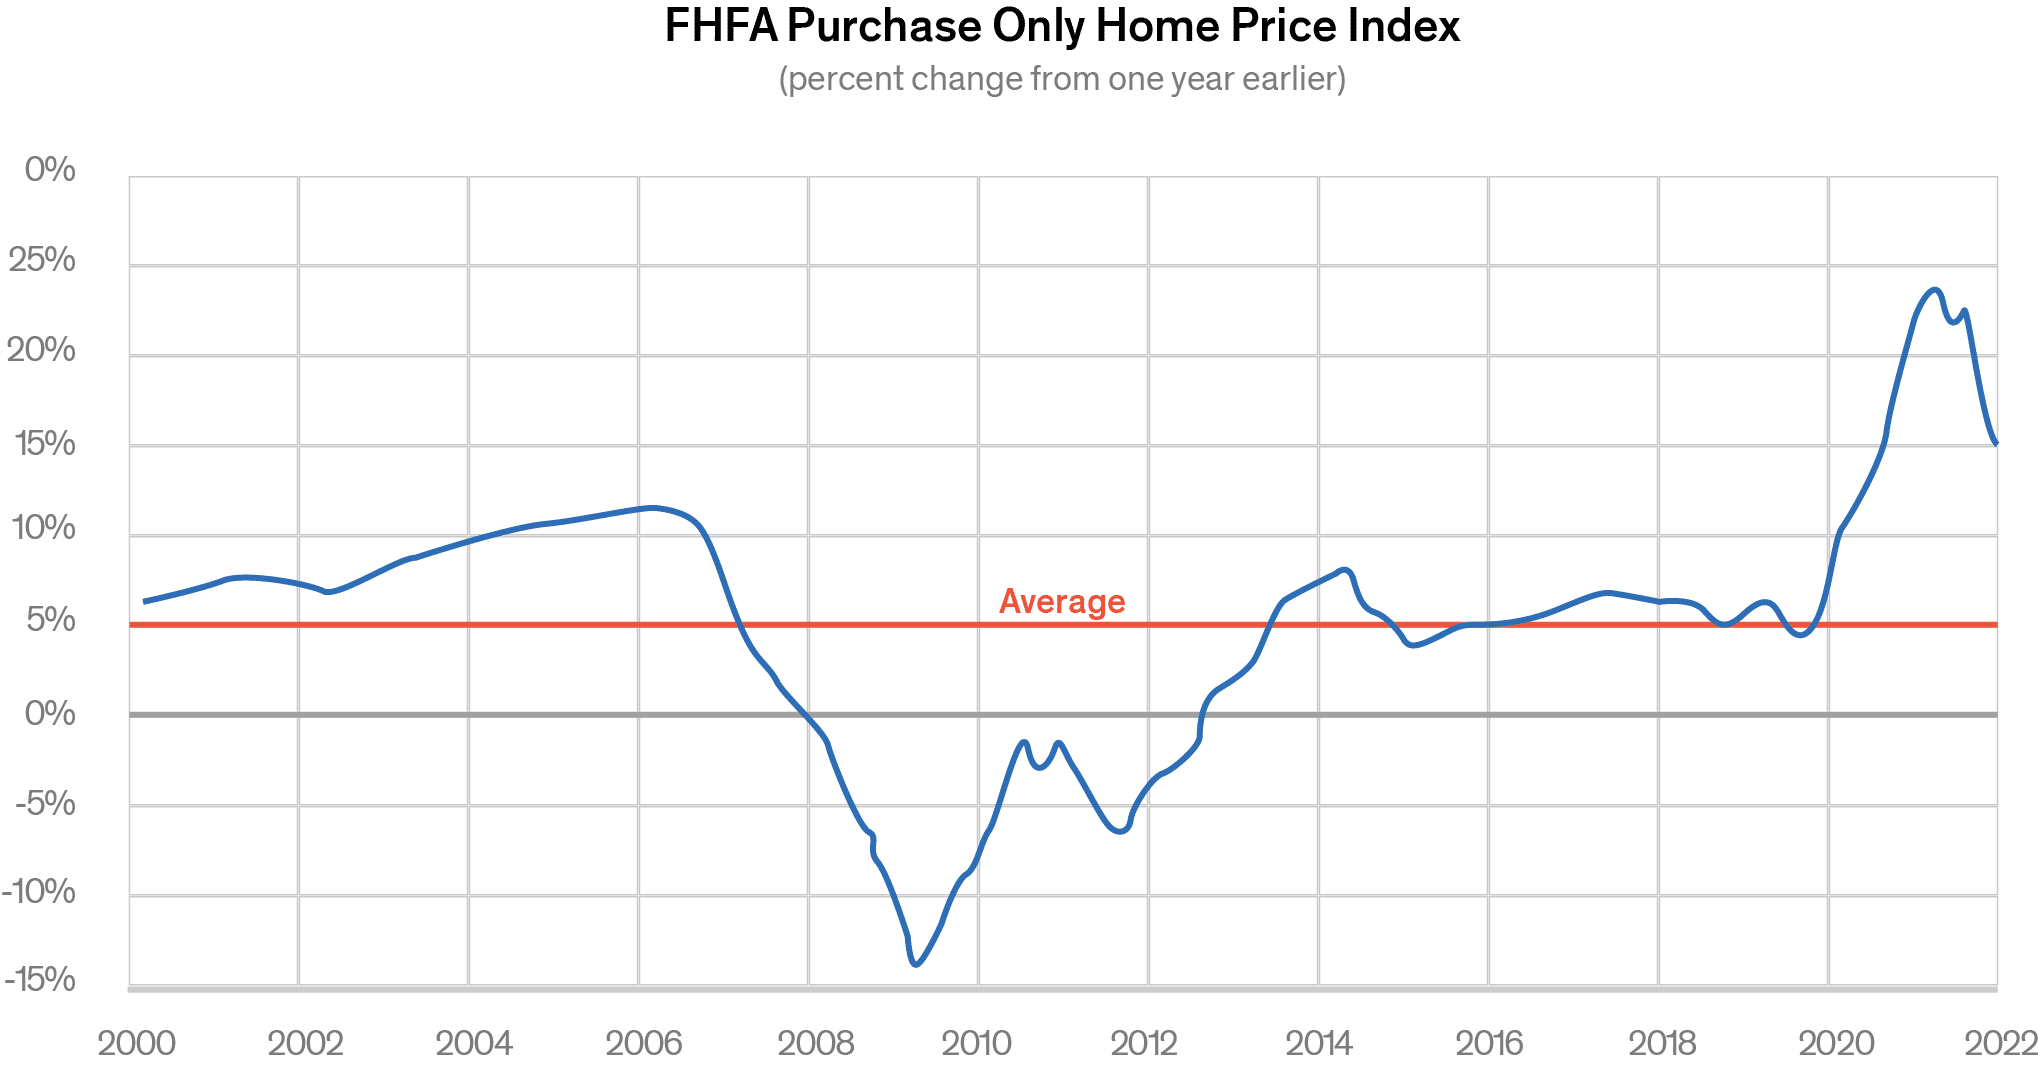
The FHFA Price Index shows that during the pandemic-era, home prices rose at a double-digit pace from late 2020 to the middle of 2022. In fact, the slowdown has been dramatic, with the latest data showing that annual home prices rose by 9.8 percent in October, roughly half the pace of just a few months before.
Although the pace of price gains has eased, over the past 20 years, the average increase has been 5 percent per year, according to the FHFA data.
Looking deeper at home price data reveals some additional insights, especially at the metro level.
Home prices at the metro level
The FHFA Price Index data includes a monthly purchase-only index covering the nine census divisions and a quarterly release with data for more than 400 metro areas, which makes it particularly useful for tracking prices in mid-size and smaller metro areas not covered by home price data from other sources.
The FHFA Price Index data shows the some of the metros that experienced the strongest price growth now rank among the metros with the fastest deceleration in home prices.
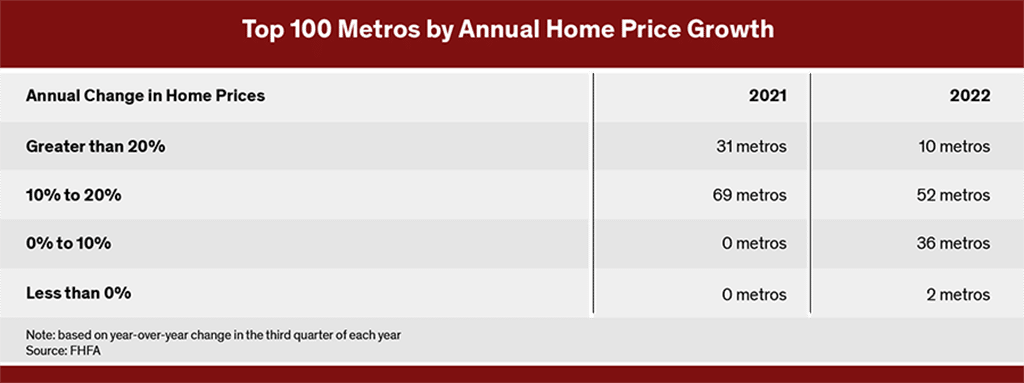
While the national price index shows that home prices have slowed, digging deeper into the FHFA data shows the extent of the deceleration. Among the top 100 metro areas, 31 posted annual price growth of at least 20 percent between 2020 and 2021 with the remaining 69 showing home price growth in the 10 percent to 20 percent range.
One year later, only 10 metros posted annual home price growth of at least 20 percent and roughly half had price growth in the 10-20 percent range. The deceleration in prices is most apparent among the one-third of the Top 100 metros that saw price growth of less than 10 percent and the two metros (Oakland, California, and San Francisco), that actually experienced a decline in prices.
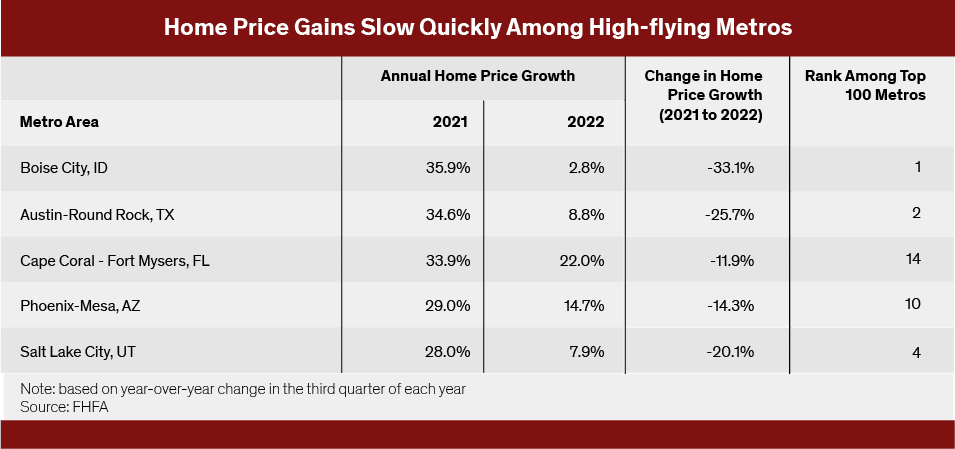
Looking more closely at the metros with the fastest acceleration in home prices in 2021, all are emblematic of the impact of the Great Reshuffling spurred on by the emergence of work-from-anywhere. As the table shows Boise, Idaho, Austin, Texas and Cape Coral-Fort Myers, Florida ranked as the top three in home price growth between 2020 and 2021 each with gains of more than 30 percent.
One year later the slowdown in home prices, evident at the national level, also played out across these metros. Based on the latest data, home prices rose by just 2.8 percent between 2021 and 2022 in Boise and by 8.8 percent in Austin. This reflects a drop in price growth of 33 percentage points in Boise and more than 25 percentage points in Austin compared with the year before.
In fact, looking across all 100 metros, Boise and Austin ranked Nos. 1 and 2, respectively, in terms of the change in home price growth. In other words, none of the other metros in the Top 100 experienced a larger deceleration in home prices over the period between 2021 and 2022.
Takeaway
Rising mortgage rates and a decrease in home sales since the middle of last year have weighed on home price growth. While home prices are still rising based on national data, not all areas have shown the same level of resiliency. At least for some of the high-flying metros that experienced the fastest price growth during the pandemic-era, the showdown in home price gains has been dramatic.