There has been a steady cadence of news stories about the outsized influence investors are having in the single-family housing market. No doubt this is true.
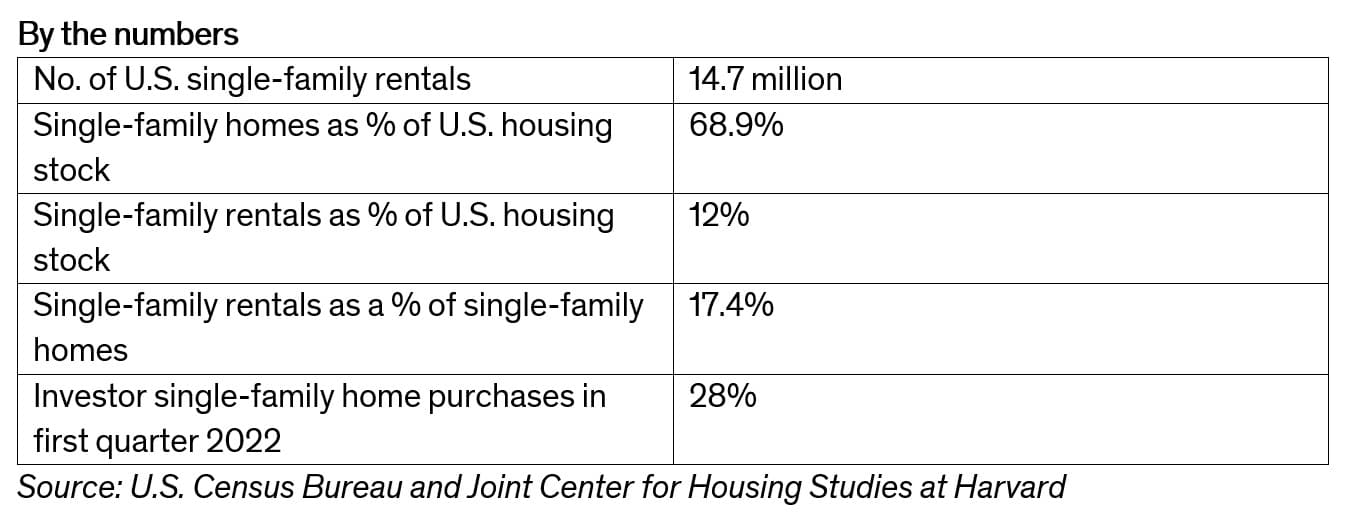
Investors purchased a record 28 percent of single-family homes in the first quarter of 2022, according to an analysis of CoreLogic data by the Joint Center for Housing Studies at Harvard. That was not only a record but is significantly higher than the roughly 16 percent of investor purchases by this group between 2017 and 2020.
This comes amidst an historic housing shortage with homebuyers facing not only higher home prices, but also higher mortgage rates, which makes monthly mortgage payments out of reach for many. For some aspiring homebuyers, renting has become the only choice, at least for now. Because the vast majority of single-family rentals are owned by investors (whether institutional or smaller), single-family rental housing stock is equivalent, in this article’s usage, to investor-owned housing stock.
While many first-time buyers have been priced out of the market, others are choosing to forego homeownership, less for financial considerations and more for lifestyle reasons. These renters tend to be somewhat older, have higher incomes, stay longer and are more likely to make the rent payments consistently and on time. All attractive characteristics for any landlord.
These circumstances have led to an increased demand for single-family rentals, which, in part, has fueled increased investor demand of this housing type.
With the increasing interest in single-family rentals by investors and rising demand from would-be tenants, the article provides some context to how the phenomenon is playing out by looking at single-family rental landscape in the largest metropolitan areas.
To provide a deeper level of analysis and context to the current impact of investors in the single-family real estate market, T3 Sixty is preparing a chapter in the upcoming 2023 Swanepoel Trends Report (which will publish in December and will be available for preorder soon) about the topic. This article explores one feature of it: the geographic impact of investor activity.
Investor impact varies by geography
While the percentage of single-family rentals is relatively small when measured at the national level, among the nation’s 50 largest metropolitan areas a different picture emerges. In some large metros, single-family rentals make up a much larger percentage of the housing stock, which greatly impacts homeownership dynamics in those cities.
The share of single-family rentals ranges from as little as 5.1 percent in New York and Boston to nearly 19 percent in Memphis.
As the chart shows below, several markets have much higher percentages of single-family rentals, investor-owned homes.
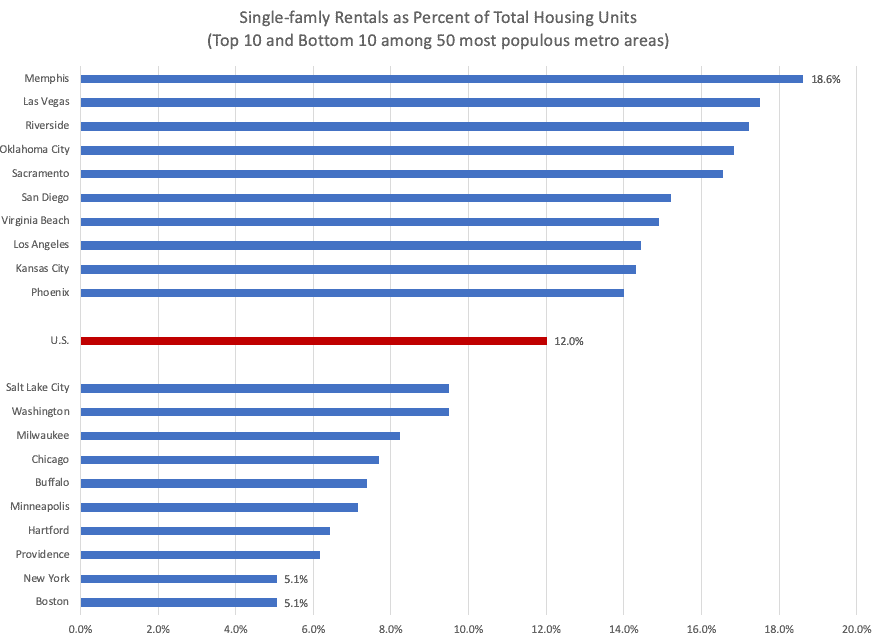
Geographically, eight of the 10 metro areas with the smallest share of single-family rentals are in the Northeast or the Midwest. Conversely, six of the 10 metros with the highest share of single-family rentals are in the West with an additional three in the South.
There are two factors that explain some of the variation in the share of single-family rentals.
First, areas with strong population growth will have a higher demand for properties of all types. Both the South and the West have benefited from in-migration from other regions of the country and greater demand for rental properties in several high-growth metros such as Las Vegas or Phoenix.
Many of these areas are also attractive to retirees who may consider single-family rentals as a primary residence or as a second home. Build-to-rent also becomes an attractive business opportunity in faster growing markets.
Second, some of the difference in the share of single-family rentals across metro areas is linked to the structure of the underlying housing stock. In denser metro areas there are relatively few single-family homes that could be converted to rentals.
While nationally, 68.9 percent of homes are single-family, in New York, its just 43.2 percent and in Boston only slightly higher at 54.5 percent. In contrast, in Memphis, 75.7 percent of the housing stock is single-family meaning that there are more opportunities for investors to purchase single-family homes to rent.
Takeaway
Although a relatively small share of the nation’s housing stock can be classified as investor-owned single-family homes, there is significant variation across the largest metropolitan areas. The impact on communities where investors play a larger role remains uncertain, but raises concerns about housing availability and affordability, questions to be explored more deeply by T3 Sixty in the coming months.