The housing market is in a period of transition. In recent weeks, the market has shown signs of slowing as mortgage rates rise and inflation takes a bite out of homebuyers’ budgets.
However, the market remains in flux, with very low inventory, still-low days on market numbers and rising prices. Some of the mixed signals include Redfin reporting that over the four weeks ending May 29, an average of five percent of homes listed for sale had price drops, the highest share over any four week period since October 2019. NAR reported that the median price of existing homes rose to $391,200 in April, an increase of 14.8 percent compared with one year earlier. At the same time, April homes sales were 5.9 percent lower over the year even though homes sold in a median of just 17 days. In the new-home market, builders report less foot traffic and the return of incentives and price cuts.
This article aims to add some specificity and insight to this whirlwind of market forces by analyzing forecasted homebuyer demand in three Northeast markets – Washington, D.C., Baltimore and Philadelphia — covered by the Bright MLS | T3 Home Demand Index (HDI), which measures homebuyer demand using MLS data and launched with Bright MLS in late 2020. By tracking buyer demand, the HDI foreshadows changes in market activity. Rather than looking backward, the HDI allows users to look ahead roughly six weeks to anticipate changes in closed sales transactions.
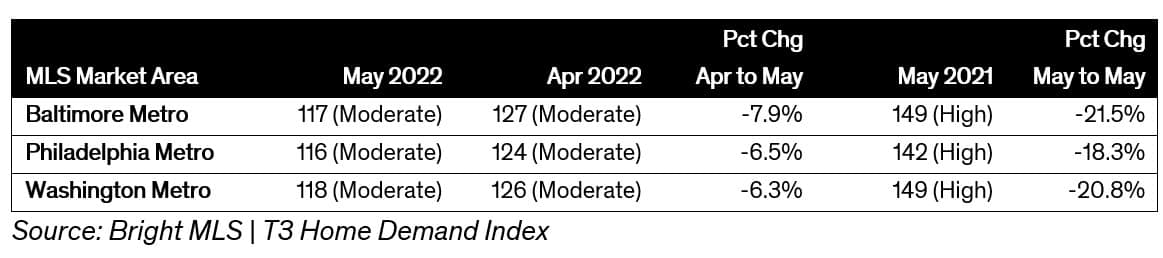
Based on the three markets it currently tracks – Washington, D.C., Baltimore and Philadelphia – the HDI shows that homebuyer demand eased in May, following a four-month run of increasing activity during the spring. In each market, demand was significantly lower than one year earlier, though still at a Moderate level, the second-highest level of the five homebuyer demand levels identified by the HDI. Recall that the spring 2021 homebuying market was particularly intense with rock-bottom mortgage rates and pent-up demand following the pandemic-related lockdowns.
Diving into Washington, D.C.
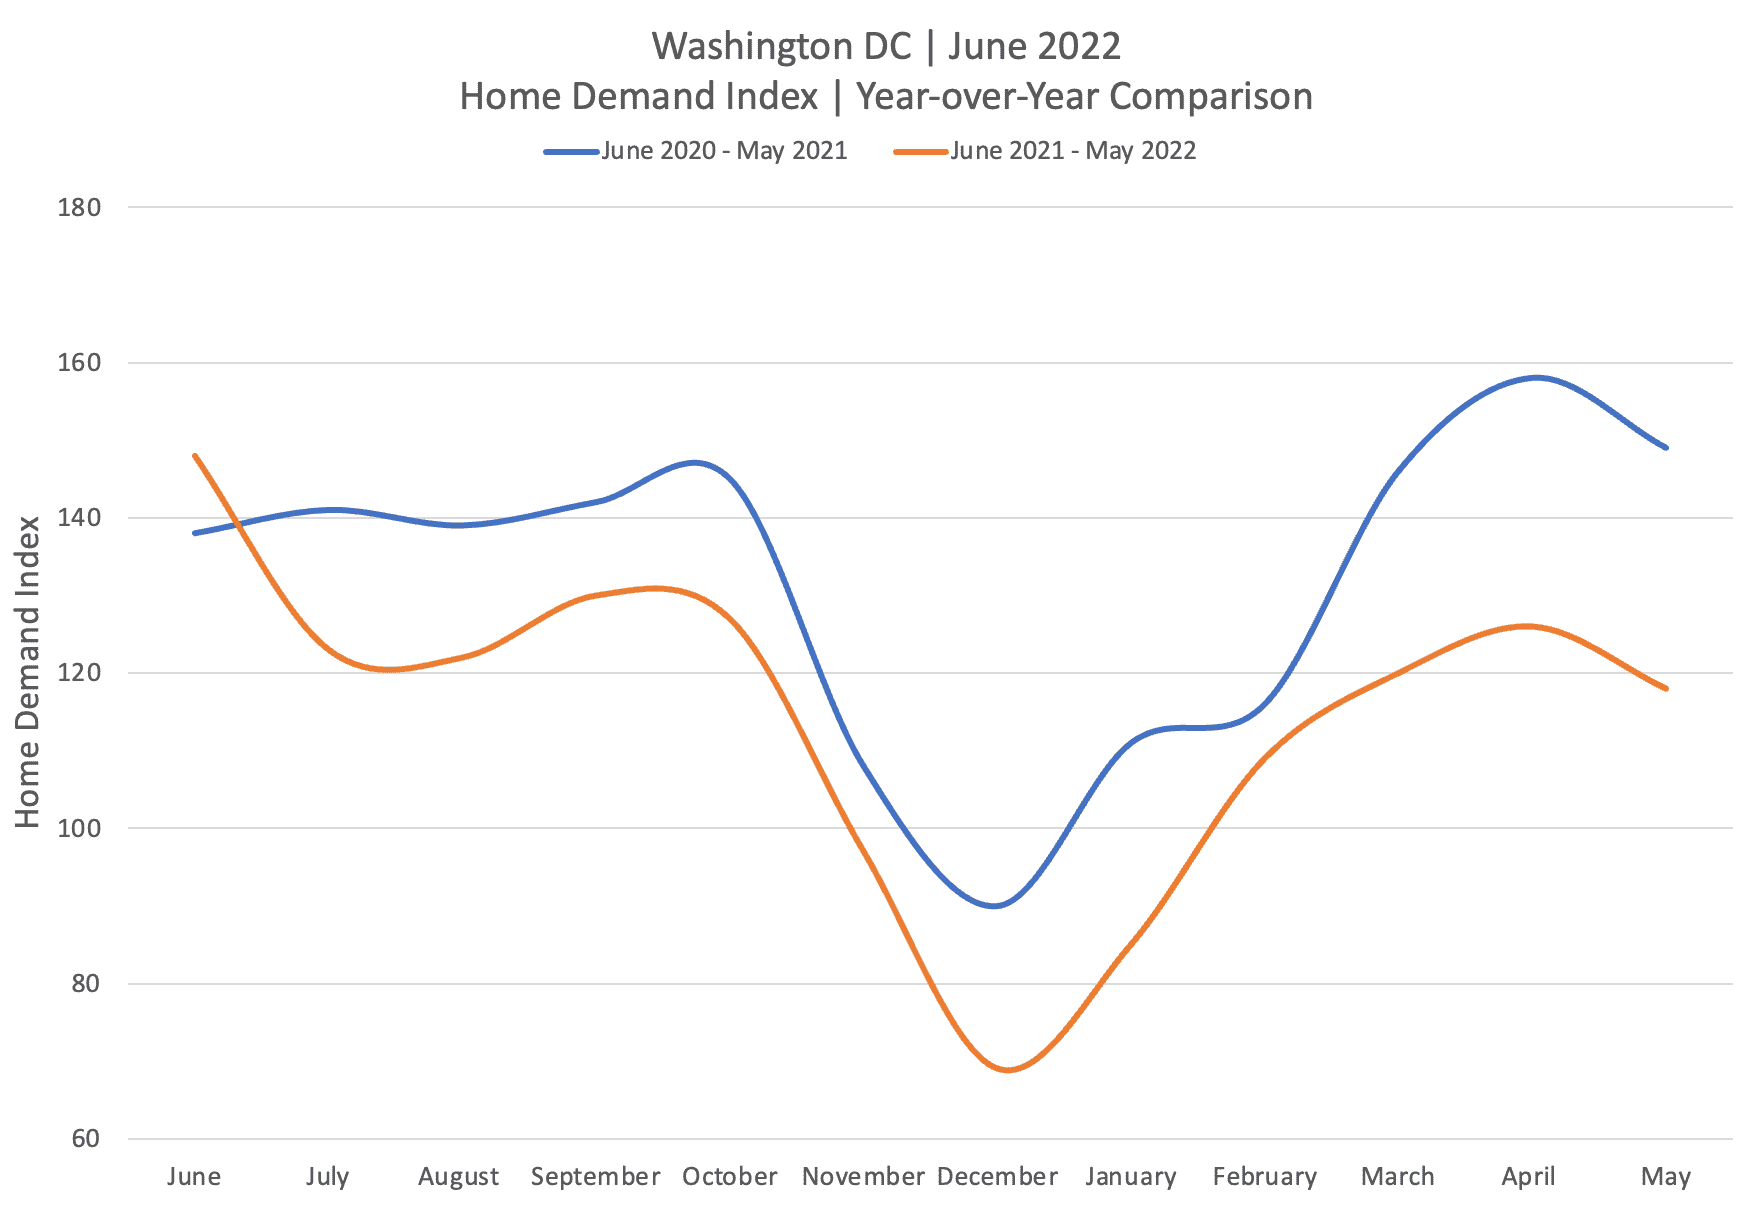
As all the metros covered reveal a similar pattern, looking at one, Washington, D.C., will provide more insight.
Year-over-year demand has dropped each month since July 2021 with the gap growing over the 2022 spring months. In fact, the HDI was nearly 21 percent lower in May 2022 than one year earlier. While some of the decrease is consistent with the expected slowdown in buyer activity as the spring rush winds down, rising mortgage rates and ongoing home price gains likely contributed.
Comparing the 12-month period June 2020 to May 2021 with June 2021 to May 2022, the Washington, D.C. HDI dropped 13.2 percent.
Lower demand flagged by the HDI is consistent with signals other indicators of market activity are sending including lower existing home sales and the return of price cuts and builder incentives. The path of demand over the next few months will determine what the second half of the year looks like for both sales and prices.
About the HDI
Consumers engage in a range of activities when searching for homes, such as requesting a showing or searching online, all of which occur weeks before the home sale occurs and shows up in the monthly data releases. By combining several forward-looking data series, limited only by the available MLS data, the HDI is designed to anticipate market conditions by tracking a selection of indicators that reflect home-shopper actions early in the process of buying a home. Furthermore, the HDI values identify the following five demand levels based upon the Index reading: Limited (less than 70), Slow (70 to 89), Steady (90 to 109), Moderate (110 to 129) and High (130 or greater).
Working with Bright MLS, T3 Sixty has taken the T3 Home Demand Index concept and applied it to a large portion of the Bright MLS footprint including the metropolitan areas of Baltimore, Philadelphia and Washington.
Takeaway
The latest HDI indicates that the housing sector may be entering a period of sustained transition as the market moves from an ultra-low interest rate environment with intense demand to one with lower demand. The most significant uncertainty is the path of mortgage rates over the next several months and what that ultimately means for home prices and the cost of homeownership.
Anticipating demand for homes is important for real estate agents and brokers who must advise their seller clients about conditions in the market so that the home is priced appropriately based local market conditions. Furthermore, homebuyers want to know what level of competition they face when placing an offer on a home.
Track each month’s result at homedemandindex.com for an early look at how the market is changing.