Homeownership is a central element of the American Dream. Those lucky enough to own homes know the benefits – security, stability, the opportunity to participate in equity, stronger ties to neighbors and, often communities. It also provides a sense of settlement, a sign of making it.
However, diving into the details of homeownership and the characteristics homeowners exhibit versus renters provides more insight into its place in American society.
To provide some insight on the current features of US homeownership, this article provides an overview of the key demographic differences between homeowners and renters and evaluates homeownership rates among several different segments of the market.
Homeowners and Renters Compared
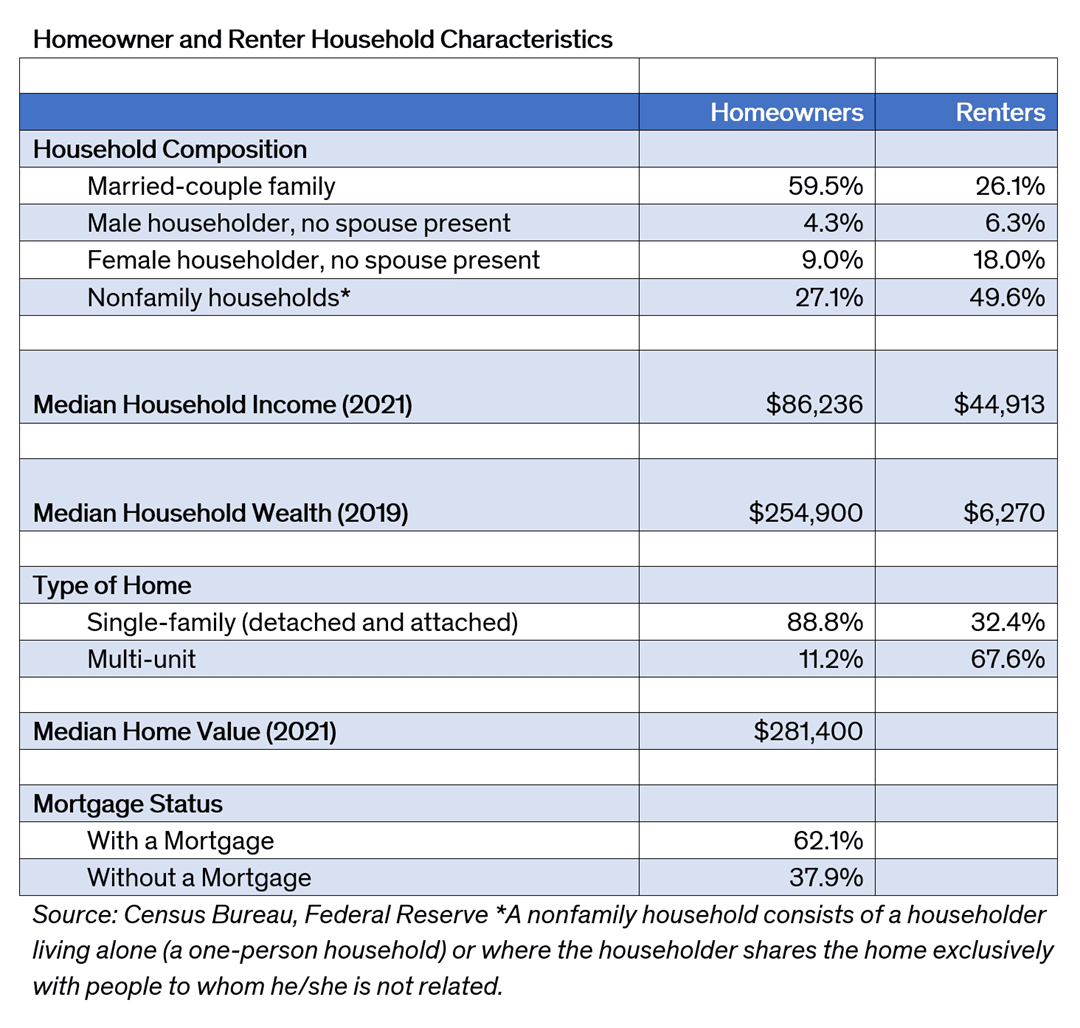
Renter and owner households differ in a several foundational ways, including marriage status, income, wealth and dwelling type. Contributing to this difference is the fact that renters tend to be younger and are in the earlier stages of their careers compared with homeowners who tend to be somewhat older.
Married couples account for a majority of homeowning households (59.5 percent) while they make up approximately a quarter of renter households, according to US Census Bureau data. Nonfamily households, which includes either one-person households or more than one unrelated individual living together, make up approximately half of renter households.
Income and wealth differences are significant between the two groups, which speaks to the difficulty that some renters have in making the move to homeownership. The median 2021 income of homeowners of $86,236 was nearly double the median income of renters for that year.
The gap in net worth between owners and renters greatly exceeds the income gap. The median net worth of homeowners in 2019 of $254,900 was approximately 40 times greater than the median net worth of renters. More than one-third of owners do not have a mortgage making the role of home equity in household wealth even more significant.
Homeownership Rates in Detail
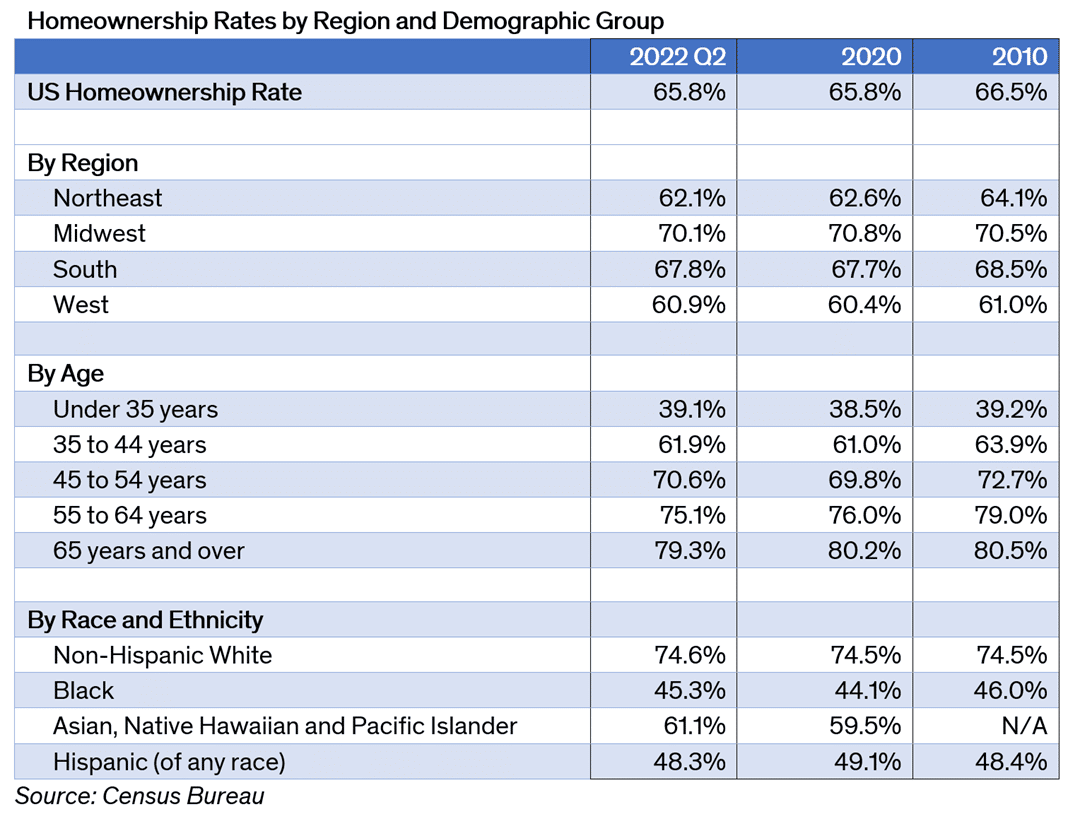
While the overall homeownership rate is 65.8 percent (as of the second quarter 2022), the rate varies widely across demographic groups and regions of the country. Geographically, the rate is substantially higher in the Midwest and South where home prices are lower than either the Northeast or the West, opening up more opportunities for ownership.
Homeownership rates also are higher for older age cohorts.
People in their 40s, 50s and older have had more time to save and accumulate a down payment, are less likely to move and generally have higher incomes than younger cohorts. As a result, they can more easily afford a mortgage and other costs of ownership compared with people in their 20s and 30s, who more often rent. The differences across the age groups are significant. The homeownership rate for those under 35 stood at 39.1 percent in the second quarter 2022; for those 65 years and older, the rate was approximately double, 79.3 percent.
Among racial and ethnic groups, roughly three-quarters of non-Hispanic White households own a home while less than half of Black or Hispanic households are homeowners. Despite efforts by policy makers at all levels of government and the work of numerous non-governmental organizations, the gap in homeownership persists.
Takeaway
To learn more about homeownership and the impacts it has on individuals, families and communities, read the chapter, “Analyzing the American Dream,” in the 2023 Swanepoel Trends Report.