Technology has become a must-have for brokerages, but developing an appropriate and meaningful budget can be difficult. The industry has countless systems to choose from, and it is not always clear what metric to look at when evaluating tech spend.
This is one of the reasons T3 Sixty decided to first analyze and then organize the industry’s technology into 63 functional categories in the Real Estate Technology Landscape (see it below) and then to identify the leading technologies in each category in the Tech 500 (published March 2020).
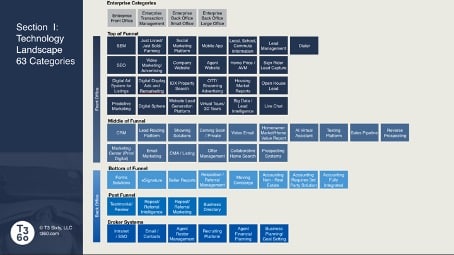
Real Estate Tech Landscape. Source: T3 Sixty
This article provides additional insights into brokerage tech-spend benchmarking numbers, and how approximately 50 brokerages from across the country (with an average agent count of 500 agents) allocate their technology budgets across the Real Estate Tech Landscape. This technology spend evaluation includes the total dollars brokerages invest in digital marketing, as these costs often overlap in tech spending.
This assessment focused on the five core sections of the Real Estate Tech Landscape: top-of-funnel, middle-of-funnel, bottom-of-funnel, post-funnel and brokerage platforms (those technologies that support brokerage operations).
Understanding Brokers’ Tech and Marketing Budgets
Brokerages rarely have technology that address all 63 real estate technology categories identified in the T3 Real Estate Technology Landscape. They usually only focus on just a handful of technologies, usually those that support their specific strategies and business model.
T3 Sixty’s analysis bore this out; brokerages analyzed used technologies that covered an average of 12.4 real estate tech categories.
These categories are fairly evenly split among those focused on front-office technology – technology that touches consumers, most often found in top- and middle-of-funnel categories – and back-office technology – non-consumer-facing systems that brokerages use to optimize operations found, most often found in the bottom-of-the-funnel, post-funnel and brokerage platform categories.
The brokerages T3 Sixty analyzed had an average annual technology and digital marketing budget of $390,000.
| Tech Landscape Section | Percentage of total Spend |
| Top of the Funnel | 28% |
| Middle of the Funnel | 35% |
| Bottom of the Funnel | 20% |
| Post Funnel | 2% |
| Brokerage Platforms | 15% |
| TOTAL | 100% |
Source: T3 Sixty
On average, technology and digital marketing represented 11 percent of the monthly expenses of the brokerages analyzed. For firms that employ developers or programmers, personnel costs averaged 5 percentage points higher than brokerages who did not, while those firms’ technology and digital marketing costs averaged 5 percentage points lower the other firms.
Company websites ranked as the most expensive tool in brokers’ overall tech and digital marketing budgets. The variety of features available for websites makes it difficult to calculate an average monthly spend and, as expected, website costs rise with quality and additional features.
In T3 Sixty’s analysis, the amount brokerages spent on their websites varied wildly, ranging from $500 to $18,000 per month. Commonly provided features include lead management, back-end communication networks (intranets) and email marketing platforms.
Evaluating tech and digital marketing spend by per-agent costs
One useful way for brokerages to evaluate their technology budgets centers on looking at how much they spend relative to the number agents they have. This helps firms not only gauge their expenditures but also to determine fees they can charge agents to recoup their technology investments (these fees can include flat monthly charges and a la carte tech fees).
The tech systems brokerages are most likely to share costs with their agents on include lead generation, agent websites, email marketing platforms and print marketing.
The brokerages T3 Sixty analyzed charged their agents fees ranging from $25 to $200 per month with an average of $75 per month. These brokerages’ monthly tech and digital marketing spend came to an average of $67 per agent, which gave the brokers analyzed an average margin of $8 per month per agent on their tech and digital marketing spends.
| Tech Landscape Section | Brokerage Tech Spend Per Agent Per Month |
| Top of the Funnel | $18.67 |
| Middle of the Funnel | $23.33 |
| Bottom of the Funnel | $13.33 |
| Post Funnel | $1.33 |
| Brokerage Platforms | $10.00 |
| TOTAL | $66.66 |
Source: T3 Sixty
These numbers provide brokerages a useful benchmark by which they can analyze their per-agent technology and digital marketing budgets and fees.
Takeaway
Brokerage firms, of course, vary in their tech and digital marketing needs and a boutique brokerage firm will obviously spend its technology budget differently than a flat-fee brokerage with a heavy focus on online lead generation. While both firms’ expenditures typically fall in a similar part of the T3 Real Estate Technology Landscape, they likely use tech in different categories.
Developing a smart tech and digital marketing strategy customized to your specific business model and goals is therefore critical. Reach out to Travis Saxton at travis@t3sixty.com to tailor your plan.