After months of work and hundreds of hours of verification and analysis, the inaugural print edition of the Real Estate Almanac is finally ready for release in June. The compedium, from T3 Sixty, provides a comprehensive snapshot of the residential real estate brokerage every year to the degree that no other publication does.
Available electronically now at realestatealmanac.com, the compendium embodies five sections that identify and list, provide stats for and rank the industry’s most powerful leaders, its largest Realtor associations and MLSs, its leading technologies, its largest holding companies and franchise brands and its largest brokerage companies, all in a single place.
T3 Sixty publishes each individual section electronically – one each month – for the first five months of each year and then compiles it into one comprehensive printed compendium each June. Anyone serious about analyzing or understanding the industry, will want a copy on their desk
All 2,500 people, companies, and organizations listed in the study receive a complimentary copy from T3 Sixty.
No other report provides a full-spectrum picture that allows readers to assess how the industry changes from year to year in all its core elements: people, companies and organizations.
The report’s sections include:
- Leaders and Executives (SP 200) ranking the industry’s most powerful leaders – published electronically each January.
- Organized Real Estate (ORE 200) ranking the industry’s largest associations and MLSs – published electronically each February.
- Technology Providers (Tech 500) organizing the industry’s most significant technology providers – published electronically each March.
- Enterprise Companies ranking the industry’s largest holding companies and franchise brands — published electronically each April.
- Brokerage Companies (Mega 1000) ranking the nation’s largest brokerage companies — published electronically each May.
Building the annual report is a rigorous process. T3 Sixty researches all leaders and companies it expects to qualify for the various sections and then scrutinizes and analyzes the data – this involves reviewing the numbers, running algorithms to identify outliers, and testing the gathered information against T3 parameters and benchmarks. Analysis also includes real estate public company 10-K financial statements and making hundreds of calls to verify data.
Brief highlights of each section are presented below.
SP 200
Throughout each year, T3 Sixty tracks personnel and company information, including company org charts, public and proprietary company information and consultations with numerous leaders and company representatives.
In 2020, Zillow Group Co-Founder and CEO Rich Barton took the top spot, followed by Keller Williams Realty Co-Founder and CEO Gary Keller, HomeServices of America Executive Chairman Ron Peltier and Realogy Holdings President and CEO Ryan Schneider who rounded out the top five.
The 2020 SP200 top 20:
1. Rich Barton (Co-Founder and CEO) Zillow Group
2. Gary Keller (Co-Founder and CEO) Keller Williams Realty
3. Ron Peltier (Executive Chairman) HomeServices of America
4. Ryan Schneider (President and CEO) Realogy Holdings
5. Glenn Kelman (President and CEO) Redfin
6. Adam Contos (President and CEO) RE/MAX
7. Bob Goldberg (CEO) National Association of Realtors
8. Robert Reffkin and Ori Allon (Co-Founders, CEO and Executive Chairman) Compass
9. Howard Hanna and Helen Hanna Casey – (Chairman and CEO) Hanna Holdings
10. Phil Soper (President and CEO) Bridgemarq Real Estate Services
11. John Peyton (President and CEO) Realogy Franchise Services
12. Gino Blefari (CEO) HomeServices of America
13. M. Ryan Gorman (President and CEO) Coldwell Banker
14. Eric Wu (Co-Founder and CEO) Opendoor
15. Glenn Sanford (Founder and CEO)eXp World Holdings
16. OB Jacobi and Geoff and Jill Wood (Managing Partners) Windermere
17. Howard Lorber (Executive Chairman) Douglas Elliman
18. Kuba Jewgieniew (Founder and CEO) Realty One Group
19. Matt Widdows (Founder and Chairman) HomeSmart
20. Sherry Chris (President and CEO) Realogy Expansion Brands
ORE 200
The 2020 Organized Real Estate section (ORE 200) revealed that the nation’s 20 largest MLSs (approximately 3.5 percent of all MLSs) serve over 50 percent of the nation’s total MLS subscribers. Eighty-two MLSs serve less than 100 brokers and agents, which suggests that more consolidates are imminent as these small orgs struggle to muster the resources to meet the growing needs of their membership.
California, Florida and Texas are the nation’s three largest state Realtor associations by membership count and the only ones with rosters above 100,000. Together, these three associations have 513,127 members (brokers and agents), over a third (36.4 percent) of the nation’s Realtor membership.
In the local association category, approximately a fifth of the nation’s 1,086 local residential Realtor associations account for 80 percent of the nation’s total membership. Surprisingly, California has no local Realtor associations among the nation’s 10 largest. Florida has three in the top 10 (Miami at No. 1, Broward, Palm Beaches and St. Lucie at No. 3 and Orlando Regional at No. 8) and Texas has two (Houston at No. 2 and MetroTex at No. 6).
Tech 500
Brokers and agents have a vast pool of technology products and vendors to choose from and needs that differ based on business model, franchise affiliation and more.
By first identifying over 270 of the industry’s leading tech solutions out of an estimated total of over 2,000, and then organizing them into specific sections and categories, T3 Sixty greatly simplifies the real estate technology decision-making process for brokers and agents with the Tech 500.
T3 Sixty built a rubric through which to evaluate real estate technology by functionality by identifying the different needs real estate brokers and agents have based on how they apply to their sales funnels and other needs in seven sections. Each section is broken into specific features totaling 63 functional categories. This framework is T3 Sixty’s Real Estate Technology Landscape (see below).
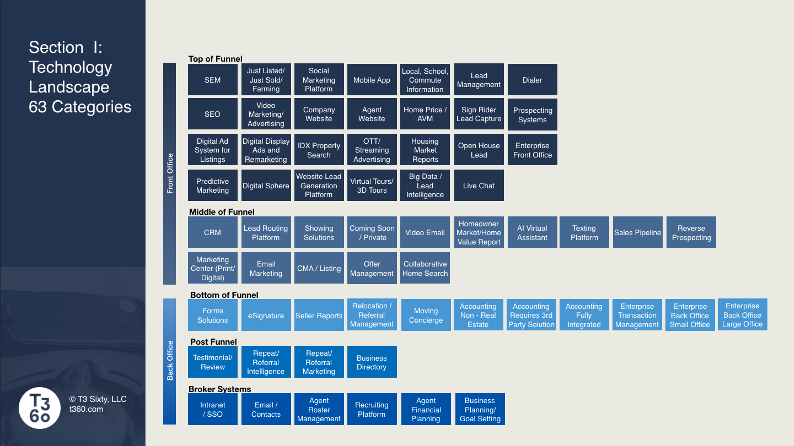
Source: 2020 Real Estate Almanac
Then, the Tech 500 presents the leading technology in each of the 63 categories, which are organized into seven sections.
The Tech 500 sections are:
- Enterprise
- Top of the Funnel
- Middle of the Funnel
- Bottom of the Funnel
- Post Funnel
- Broker Platform
- Other Technologies
Enterprise
Enterprise makes up the fourth section of the Real Estate Almanac. It lists the nation’s largest real estate holding companies, which include a company’s owned brokerage and franchise divisions, and franchise brands.
With a 2019 sales volume of $504.21 billion, Realogy Holdings Corp. again ranks as the nation’s largest residential real estate holding company despite seeing a 1.44 percent annual sales volume drop from 2018. The following holding companies round out the top five by 2019 sales volume:
- Keller Williams Realty, $336.59 billion (up 4.51 percent from 2018)
- RE/MAX, $269.93 billion (up 2.78 percent from 2018)
- HomeServices of America, $206.08 billion (down 0.91 percent from 2018)
- Compass, $91.27 billion (up 100.40 percent from 2018, thanks to big acquisitions)
Keller Williams Realty, with a sales volume of $336.59 billion, stands out as the nation’s largest franchise brand for the second consecutive year in the 2020 Enterprise report.
The following franchise brands filled out the top five by 2019 sales volume:
- RE/MAX, $269.93 billion (up 2.78 percent from 2018)
- Coldwell Banker Real Estate, $240.12 billion (down 2.47 percent from 2018)
- Berkshire Hathaway HomeServices, $115.43 billion (up 2.69 percent from 2018)
- Sotheby’s International Realty, $102.29 billion (up 2.24 percent from 2018)
This section shows that the nation’s 20 largest real estate holding companies handled 52.79 percent of existing home sales volume in 2019, up from 51.75 percent in 2018 and 49.42 percent in 2017.
Mega 1000
The Mega 1000, which ranks the nation’s 1,000 largest brokerages by annual sales volume, shows some familiar names at the very top – Realogy Brokerage group at No. 1 and HomeServices of America at No. 2. However, some younger companies, based off years of sustained growth, have jumped into the top five: No. 3 Compass, No. 4 eXp Realty and No. 5 Redfin.
The top five residential real estate brokerages by 2019 sales volume are:
- Realogy Brokerage Group – $170 billion
- HomeServices of America – $132 billion
- Compass – $91 billion
- eXp Realty – $36 billion
- Redfin – $30 billion
The top five rankings shift slightly when ranking by 2019 transaction sides. The ranking goes:
- HomeServices of America – 329,680 transaction sides
- Realogy Brokerage Group – 325,652 transaction sides
- eXp Realty – 130,627 transaction sides
- Howard Hanna Real Estate (with Allen Tate) – 101,512 transaction sides
- Compass – 84,732 transaction sides
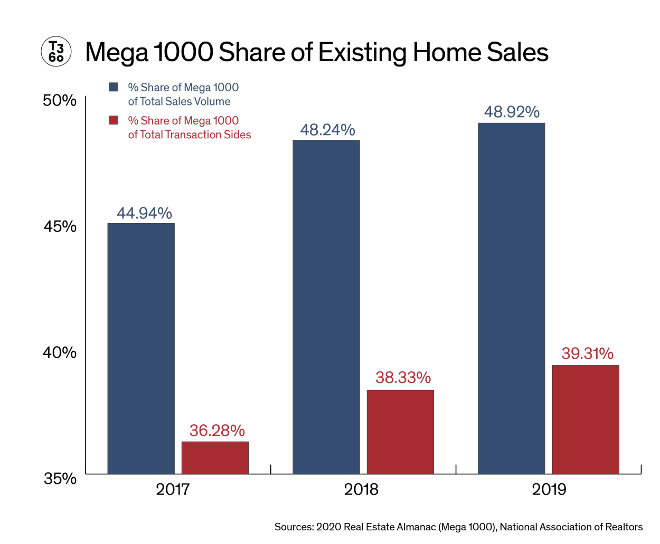
The report also reveals that production is increasingly concentrating among the nation’s 1,000 largest brokerages.
In 2019, these companies did 48.9 percent of all existing-home sales volume, up 1.4 percent from 2018 and up 8.9 percent from 2017. Transaction sides of the nation’s 1,000 largest brokerages saw a similar jump.
Takeaway